
Using Graylog2 messages as annotations in Grafana
04 Feb 2015A central logging infrastructure like Graylog2 or Logstash is something that shouldn't be missing in modern data centers. The same is true for aggregation and graphing of your infrastructure, application and business metrics.
These metrics can be centrally collected with tools like Graphite, OpenTSDB, or InfluxDB.
But real #monitoringlove comes into play when you combine metrics and events into a single graph. Imagine the following scenario: You discover an anomaly in your metrics and start digging into it. Next you find log messages that could potentially correlate with the anomaly. Now you want to see if every time the anomaly occurs the same message is logged as well. Basically you want to see the correlation of metric and event time in a single graph. This is something that really would have been helpful for the past 10 years I have been working in systems engineering.
This is where Grafana and it's annotation feature comes in handy and what I'd like to describe in combination with Graylog2 in this post. Similar to the popular Elasticsearch/Logstash/Kibana ELK-Stack Graylog2 uses Elasticsearch as search engine as well.
Requirements
- Browser needs to have access to the Elasticsearch API
- The Elasticsearch API is configured as a data source in Grafana's
config.js
elasticsearch: {
    type: 'elasticsearch',
    url: "http://elasticsearch:9200",
    index: 'graylog2',
    grafanaDB: false,
}
Building a log query in Graylog2
In this example I'm querying for the start of all sudo root sessions:
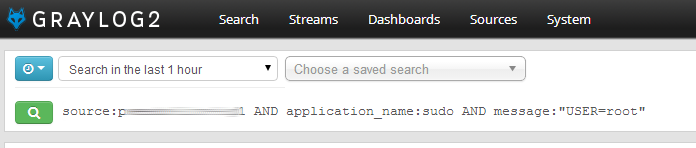 The hostname of the source system will be replaced with a variable by Grafana.
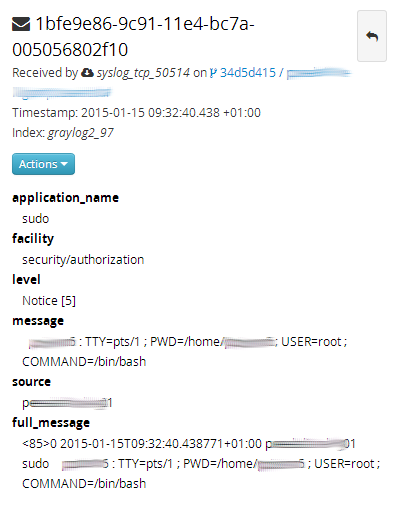
 The details of this filtered message show the information you need for adding a Grafana annotation.
Add an annotation in Grafana
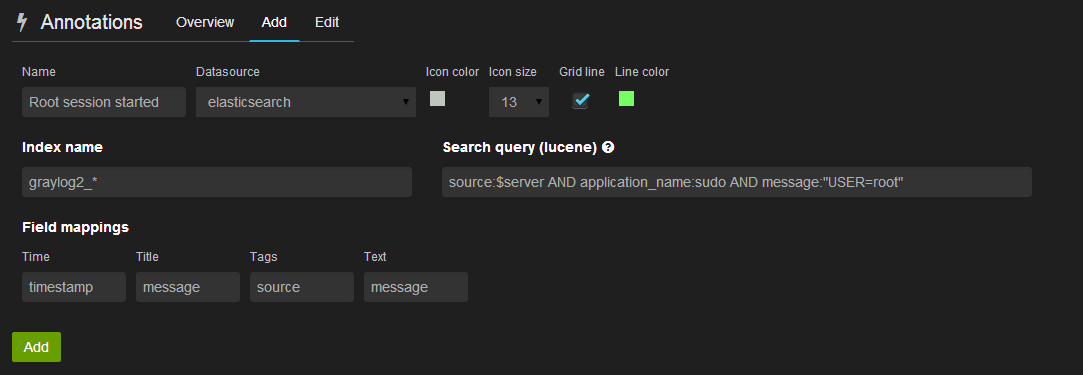
- Use the information from the Graylog2 message
- Use a wild card for the index name, as Elasticsearch populates the indexes with a prefix
- Replace the server name with a variable, if you're using templated dashboards.
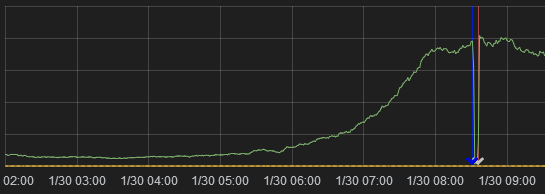
Now your done and should see an annotation marker in your graph. I.e:
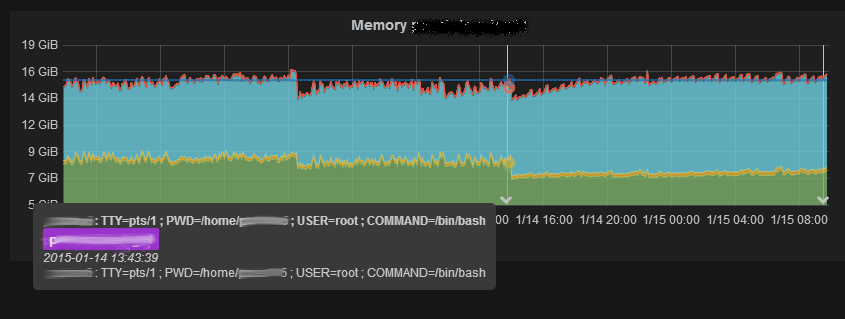
This is a very trivial example, but image having your graphs annotated with log messages like:
- Changes done by your configuration management system, like Puppet, Cheft, Ansible etc.
- Code commits, automatic software deployments, daemon restarts
- Application specific events
Troubleshooting
The best way to troubleshoot this is to use Chrome Development Tools or Firebug and enable/disable the display of annotations.
In the Network tab you should see the HTTP POST requests to http://elasitcsearch:9200/graylog2_*/_search
Please note that the annotations with Elasticsearch only seem to work (at least for me) if you're use a time range like "2 days ago".
If I drill into a graph or define an explicit time range, I've get an "Annotation error" resulting from a Elasticsearch API: ElasticsearchParseException[failed to parse date field [2015-01-29T01:42:29.330Z], tried both date format [yyyy-MM-dd HH:mm:ss.SSS], and timestamp number]